Multi-Omics CoAnalysis (MOCA) Software
Background
Integrating metabolomics with other omics data is key to providing a comprehensive understanding of the regulatory network(s) that control metabolism and metabolic pathways, and is central to enabling predictive biology. Specifically, integration of transcriptomics and metabolomics data may lead to identification of gene networks involved in metabolite
biosynthesis and regulation of metabolic pathways that are currently unidentified.
Brief Description
Researchers at the University of California, Riverside have developed a software program named Multi-Omics CoAnalysis (MOCA), which is an integrative, interactive, and informative (i3) workbench. Using MOCA, researchers will be able to statistically analyze and interactively visualize the experimental data and generate the corresponding correlative omics data. Data can be presented in various formats including box plots, line plots, heat maps, volcano plots, principal component analysis, coefficient distribution plot, and network plot with an adjacency matrix. The graphical user-interface (GUI) of MOCA delivers intuitive and interactive data visualizations, and enables access to many types of metadata and experimental data in a user-friendly manner.
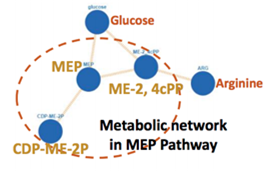
Fig 1: MOCA-generated image of a metabolic network in MEP pathway
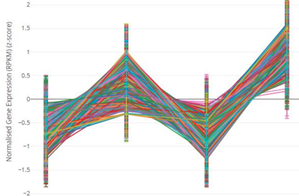
Fig 2: MOCA-generated pattern plot by using machine learning
Suggested uses
- To statistically analyze and interactively visualize large-scale experimental data and to integrate multi-omics data using the correlative analyses
Patent Status
Patent Pending
Contact
- Grace Yee
- grace.yee@ucr.edu
- tel: View Phone Number.

Other Information
Keywords
transcriptomics, metabolomics, proteomics, omics data, metabolite, transcript, proteome, statistical analysis, multi-omics, visualization, co-analysis, correlational analysis