UCSF Chimera: Molecular Modeling Software for Visualization and Analysis of Molecular Structures
Invention Novelty
This invention consists of software that facilitates modeling and interactive visualization of molecular structures and related data.
Value Proposition
Modeling and visualization of molecular structures are critical for gaining insight into biological function and molecular interactions, as well as for drug design and development. To address researcher needs, the extensible software platform UCSF Chimera has been developed by the Resource for Biocomputing, Visualization, and Informatics (RBVI). This software allows for 3-D visualization and structural analysis of molecular entities, and enhances researcher workflow with novel extension features.
This software offers the following advantages:-Rich set of features accessible through both commands and graphical interfaces
-Visualization of molecular data on all scales, including large molecular assemblies
-Integrated sequence and structure views
-Production of high-quality images and movies for publication and presentation
-Designed to accommodate outside development of software extensions
-Broad use for academic and industry researchers, educators, and students
Technology Description
UCSF Chimera offers 3-D visualization of molecular structures and related data, including density maps, supramolecular assemblies, molecular dynamics trajectories, and multiple sequence alignments. The user can also create images and animations for publication and presentation. Besides supporting core visualization, the software is specifically designed for extensibility, to allow outside developers to incorporate new desirable functions. Current extensions include Multiscale Models to visualize large-scale molecular assemblies like viral coats, ViewDock to screen docked ligand orientations, Volume Viewer to visualize density maps, and Multalign Viewer to display sequence alignments, with crosstalk to any associated structures.
Some examples include:
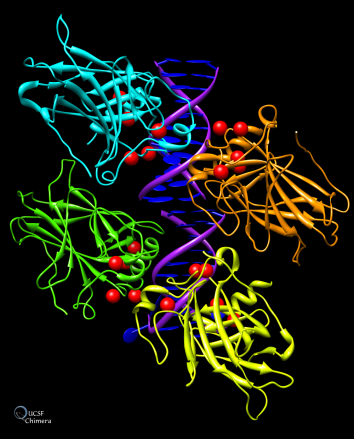
1. Graphical representation of tumor protein p53 binding to DNA, with locations of cancer-associated mutations marked in red:
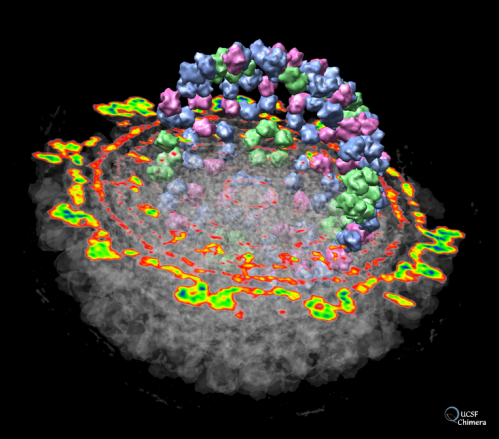
2. Graphical representation of an electron density map of the Semliki Forest virus. The virus is able to cause a lethal encephalitis in rodents, but generally only mild symptoms in humans:
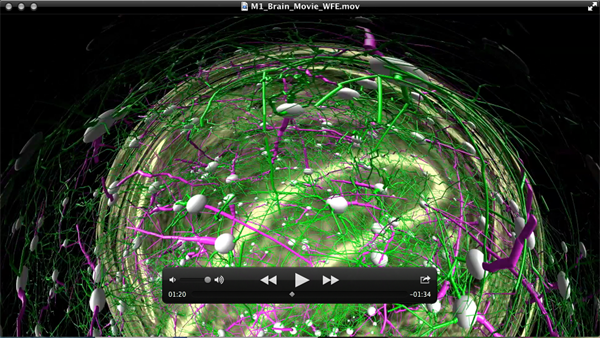
3. Video of Human Brain: Images to Atoms. January 31, 2014 (Direct Link - https://www.youtube.com/watch?v=RE2XMzInX_o) The images appear distorted as this video was intended to be projected onto a dome-shaped projection screen.
Related Materials
- First publication: UCSF Chimera – a visualization system for exploratory research and analysis (J Comput Chem. 2004)
- This invention also has a list of many associated publications.
Other Information
- Non-profit organizations: Available for download at https://www.cgl.ucsf.edu/chimera/;
- For-profit organizations: Please contact Darya Bubman, PhD, Licensing and Material Transfer Associate (darya.bubman@ucsf.edu) for licensing inquiry
Contact
- Heather Pittman
- heather.pittman@ucsf.edu
- tel: View Phone Number.

Inventors
- Ferrin, Thomas E.
Other Information
Keywords
Molecular structural analysis, Structural biology, Bioinformatics